The Internet, as a global system of interconnected networks, carries an extensive array of information resources and services. Its fundamental design principles have made it a robust, widely accessible and essentially indispensable utility. On the other hand, the heterogeneity and non-centralized management of the network, has made it susceptible to a variety of threats ranging from simple brute-force exploits of software and protocol vulnerabilities to sophisticated and distributed attacks, orchestrated by malicious ‘end-users’. For example, network operators have to deal, more frequently than ever before, with voluminous Distributed Denial of Service (DDoS) attacks that choke network backbone links and disrupt service availability [1], [2]. Continuous and efficient network monitoring is thus key to prevention and mitigation of network threats.
At the same time, the rapid growth of Internet traffic (see e.g., [3]) deems efficient and accurate monitoring a challenging task. Collecting and storing Internet packet information arriving at multi-10Gbps would require a tremendous amount of fast storage (for example, storing packet header information, say the initial 96 bytes of an Ethernet frame, from a 10 GE link at a rate of 1.8 million packets per second requires 1.7 GB per 10 seconds or around 15 TB per day) and would make post-mortem forensics analysis and querying of such data a formidable task. The industry has developed monitoring standards such as NetFlow, which effectively compress the packet meta data by grouping them into flows. This compression mechanism, however, creates an intermediate step, which introduces a delay (usually between 1 to 5 minutes) in the access to traffic meta-data. Further, in production settings traffic needs to be heavily sampled (sampling rates of 1:1000 or 1:10000 are common) in order to cope with the traffic volume and not overload the collection machine (i.e., the switch/router).
Merit Research and our collaborators from University of Michigan and University of Florida have been working on a new monitoring paradigm that would allow network operators to monitor streaming data (i.e., arriving data never get stored on disks) at multi-10Gbps in real-time. AMON (All-packet MONitor) processes all packets (no sampling!) passing through a network interface, and allows real-time visualization of traffic intensity and structure, identification of heavy-hitters and automatic detection of high-impact events such as DDoS attacks [4]. While other tools (e.g., Snort, Bro, Suricata) might also be able to process multi-10Gbps packet streams, such tools rely on signature-based methods to examine traffic data for known malicious patterns. AMON, instead, is behavioral-based and no a priori knowledge of attack signatures is required. In a series of blog posts, we will describe AMON’s functionality, and its main modules for visualization, identification and detection. Today we start our discussion with its visualization module (module C in Fig. 1).
AMON is an open-source tool, built on top of PF_RING [5], and its mode of operation is to passively monitor packets arriving on a packet tap server (through port mirroring, see Fig. 1). It utilizes PF_RING’s zero-copy mode that allows packets to be consumed by AMON’s monitoring process directly as they arrive at the NIC card (i.e., avoiding copy operations within memory).
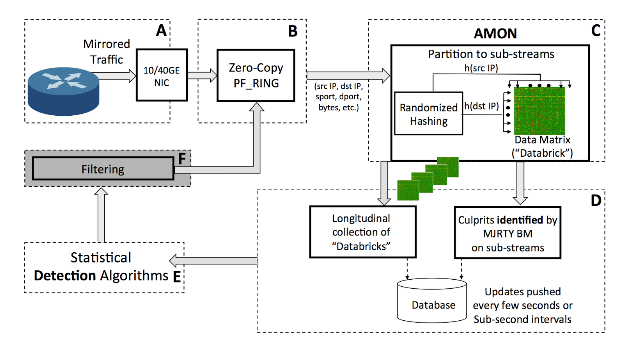
Fig. 1 AMON’s high-level architecture (see [4])
When a packet arrives, AMON extracts the source and destination IPs from the packet header, and the packet length. Using this information from all packets, it updates the so-called databrick data structure (an example of a databrick is shown in Fig. 2). A new databrick structure gets created every few seconds (e.g., 10 seconds) and gets emitted to a user-defined monitoring location (such as a database).
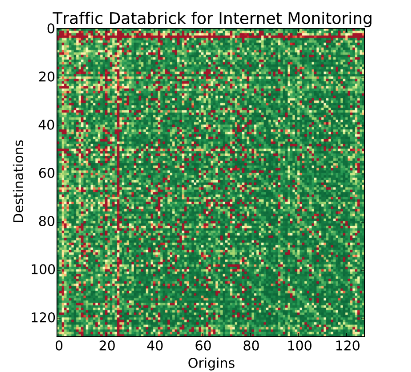
Fig. 2 AMON’s databrick structure
As a real-world example, we display an animation below that illustrates AMON in action! In the following case study, AMON’s visualization module displays the databricks as captured during the course of a large DDoS attack against Merit’s RADb service back in January 2016. Notice how one can immediately observe the onset of the DDoS attack (red horizontal stripe appearing at time 0:06 seconds in the animation below) and the time when the DDoS attack gets mitigated.
REFERENCES
- [1] Jakub Czyz, Michael Kallitsis, Manaf Gharaibeh, Christos Papadopoulos, Michael Bailey, and Manish Karir. “Taming the 800 pound gorilla: The rise and decline of ntp ddos attacks”. In Proceedings of the 2014 Conference on Internet Measurement Conference, IMC ’14, pages 435–448, New York, NY, USA, 2014. ACM.
- Arbor Networks. Worldwide infrastructure security report, 2015.
- [2] R. Lee, M. Assante, and T. Conway, “German steel mill cyber attack,” 2014.
- [3] The bandwidth bottleneck that is throttling the Internet, http://www.nature.com/news/the-bandwidth-bottleneck-that-is-throttling-the-internet-1.20392.
- [4] M. G. Kallitsis, G. Michailidis, and S. Tout, “Correlative monitoring for detection of false data injection attacks in smart grids,” in IEEE SmartGridComm 2015, Miami, Florida, November 2015.
- [5] PF_RING. http://www.ntop.org/products/packet-capture/pf_ring/.